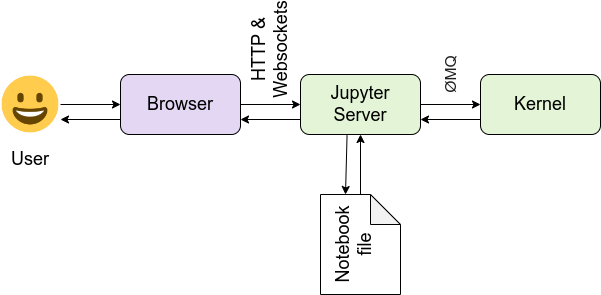
(https://jupyter.readthedocs.io/en/latest/projects/architecture/content-architecture.html)
One possible solution for achieving this has been mentioned in below stackoverflow thread.
However, when this code is executed, it has to generate every frame in the server-side and download the image to update the notebook's output cell. Apart from that, we have to call,
display.clear_output(wait=True)
in-order to avoid notebook from drawing each frame as a new image, resulting in thousands of images repeated in the output cell. This could even crash the browser at some point.
The alternative is using Javascript!
IPython.display package comes with two functions HTML and JavaScript that can be used to embed and call html/javascript in the output cell. Hence we can leverage this feature to embed a chartjs or any other JavaScript based chart in the output cell and dynamically update the chart using chartjs JavaScript APIs. The source code can be simple as follows.
The mock data source is still generating data at the server-side, but unlike the previous case, it's now sending just js function that has to be called along with the function arguments. Which is a very lightweight payload compared to the pee-rendered image data sent in the previous approach. Additionally, we no longer have to repeatedly call clear_output, which will directly clear the HTML part of the output cell and re-render new image. Now with the chartjs library we are directly redrawing on the canvas, which is super efficient compared to previous approach.
Given below is a link to the Google Colab notebook that you can try out immediately.
https://colab.research.google.com/drive/1k6z0qgmTJiNObWazKkywe-II29Wn4psP?usp=sharing

Comments
Post a Comment